


Icinga or Nagios can be easily used to monitor Windows Performance Counters. This is quite useful, because the most “monitor-relevant” information from Windows Systems is available through Performance Counters.
So, let’s start.
First we’ll do the Windows-Part.
Grab a copy of NSClient++ (Thanks a lot to Michael Medin for his great work on this AddOn) at http://nsclient.org/nscp/
I prefer the ZIP-Package and a manually installation. But it doesn’t matter if you want to install the MSI. Just take care that you use the 32 or 64 Bit Version.
- If you have the ZIP-Package as well, just unpack it and move the files to a folder you like (I use C:\Tools\NSClient++).
-
Open nsc.ini and make the following changes:
- Line 14: Uncomment NRPEListener.dll
- Line 117: allow_arguments=1
- Line 121: allow_nasty_meta_chars=1
- Line 125: use_ssl=1
- Line 135: allowed_hosts=<IP of your Icinga/Nagios Host>
Explanation: You need allow_arguments and the nasty_meta_chars for Performance Counters, because we need the Backslash to specify them.
use_ssl and allowed_hosts is just for security reasons, but I suggest to use them
- Start a command prompt and navigate to the directory where you’ve unpacked your NSClient++ Files (make sure you’re running the command prompt as Administrator)
-
Test if NSClient++ is working => “NSClient++.exe” /test
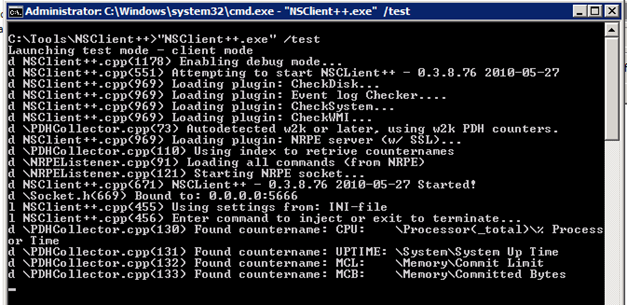
If the output looks good (if no error is displayed) exit the Test-Mode with, tada => Exit 😉
This Test-Mode is really handy if a query on the Monitoring-Host doesn’t return the result you expect. Just fire up the Test-Mode and run the query again.
-
Now it’s almost done. Just install the service and start it.
- “NSClient++.exe” ÔÇôinstall
- net start nsclientpp
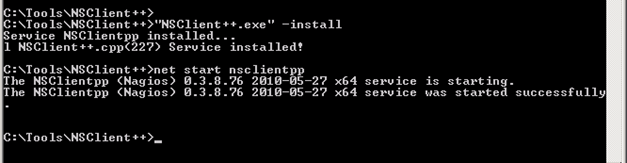
- That’s it, the Windows-Part is done ?
So, now it’s time for the Linux-Tasks.
We need the check_nrpe Plugin. You can either install it with aptitude (aptitude install nagios-nrpe-plugin) or grap a copy of the NRPE source at: http://www.nagios.org/download/addons
Again, I’m a fan of compiling such stuff myself. So let’s do it.
- Unpack the archive => tar ÔÇôxzf nrpe-2.12.tar.gz
- Run the configure-command. Just make sure to include the “ÔÇöenable-command-args” option => ./configure –enable-command-args –enable-ssl
Again, –enable-ssl isn’t necessary, but a recommendation. Futhermore maybe it’s necessary to add some other config-switches to fit your environment. - Compile the package => make
- It’s not necessary to install the package, we just the the check_nrpe binary from the ./src directory.
- Copy the check_nrpe binary to your libexec dir of Nagios or Icinga => cp src/check_nrpe /usr/local/icinga/libexec/
Last but not least, the Nagios/Icinga Config
First, we’ll create a new command for checking Performance Counters
- Edit your commands.cfg (by default in /usr/local/icinga/etc/objects/commands.cfg) => sudo vim /usr/local/icinga/etc/objects/commands.cfg

Again, this is just a recommendation. But I prefer a “generic” command and put the detailed definition into services.
- Now add a new service (by default in /usr/local/icinga/etc/objects/services.cfg) => sudo vim /usr/local/icinga/etc/objects/services.cfg
You must use double Backslashes for the Counters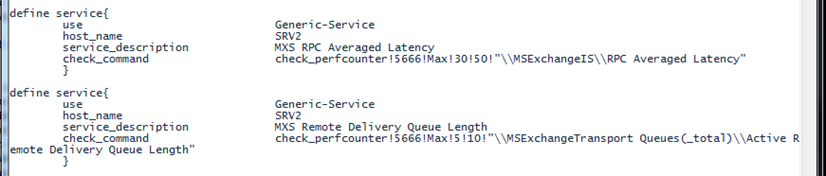
-
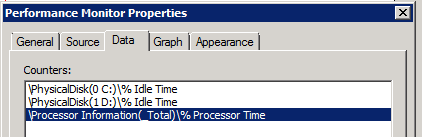
How to get the name of a Performance Counter?
Use the Windows Performance Monitor (Start -> Run -> perfmon) and add the counters you want to monitor. After that switch to the properties of your current Performance Monitor Session (Action -> Properties or Right Click to the Graphs -> Properties). At the Data-Tab you’ll find the right name. Just make sure to use double Backslashes in your Icinga/Nagios Config.
-
Save both files ( :wq 😉 ) , check the config and reload Icinga
- sudo /etc/init.d/icinga checkconfig
- sudo /etc/init.d/icinga reload
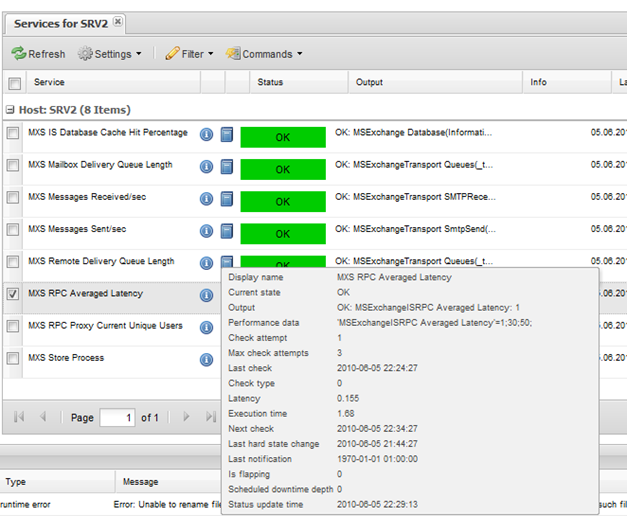
- Look at the results of the check in the Web Interface (I’m sure you’re already running Icinga-Web, or not? 😉
Some troubleshooting tips:
- Before adding a service, run the check on the Linux command line.

-
Of you do not get the result you expect with the “remote run” (see above) try to run the check locally on the Windows Machine.
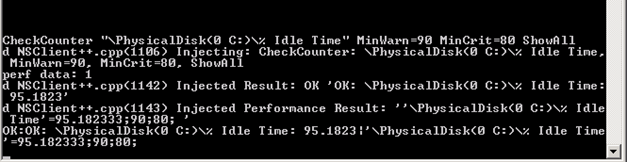
- Start NSClient++ in Test-Mode; You can do that while the service is running. You’ll get an error that no socket can be bind, but it’s ok => “NSClient++.exe” /test
-
Run the check without double Backslashes (they are just necessary for the remote execution)
Hope this post is helpful for you. If you miss something, or if some steps are not clearly enough just let me know.
Good luck and happy monitoring ?
Leave a Reply